

Figures (Includes Tables)

Sub-Title
Abstract
Introduction
Congenital hearing loss is a common condition in children with a prevalence of 3-5 per 1000 live births.1 While environmental and prenatal factors are common in low-income countries, genetic causes account for the majority of cases.2 Based on the site of the pathology, congenital hearing loss can be categorized into sensorineural, conductive and mixed. Sensorineural hearing loss (SNHL) occurs due to damage to inner ear, auditory nerve or central auditory pathway and represents the most common form of permanent congenital deafness. Any component of the hearing pathway can be affected by genetic mutation leading to varying degrees of hearing loss.
Neonatal hearing screening programmes help in early diagnosis of hearing loss and timely intervention improve developmental outcomes later in childhood. Cochlear implantation has become the standard treatment for children with severe to profound hearing loss who have limited benefit from hearing aids. However, there is substantial variability in speech outcomes post-surgery. There are several factors that affect speech and language outcome post implantation. These are age at implantation, etiology and duration of hearing loss, baseline auditory status, presence of additional disabilities, and rehabilitation intensity.3, 4 There is increasing evidence to suggest that genetic etiology is the most important determinant of post-operative performance.5, 6 Despite this, predictive outcomes in routine clinical practice rely on clinical experience and audiological assessments. Current methods for predicting cochlear implant outcomes rarely take genetic etiology into consideration.
Machine learning approaches offer the possibility to combine several biological and clinical variables to generate personalized outcome predictions.7 These models can help in identifying suitable candidates for implantation, guide in preoperative counselling and help in designing personalised rehabilitation strategies. Although a few studies have explored machine learning models to predict CI outcomes using genetic findings and other variables, clinical validation of these models in patients remains limited.8 Furthermore, none of the studies have compared the predictions with standardised developmental assessment tools.
The aim of the present study was, therefore, to evaluate the clinical performance of a machine learning model previously developed to predict speech outcomes after cochlear implantation using genetic diagnosis and age at implantation.9 The study further aimed to compare the model predictions with actual postoperative speech outcomes to evaluate its utility as a support tool for clinical decision making.
Methodology
2.1 Study Design and Patient Selection
This was a clinical validation study of a previously developed machine learning model for prediction of speech outcome following cochlear implantation. It aimed to evaluate the performance of this model when applied prospectively to a new, independent group of pediatric CI recipients from a single clinical center (Sankalp ENT & Cochlear Implant centre, Delhi).
Written informed consent was obtained from the parents or legal guardians of all participating children for genetic testing and collection and recording of relevant clinical and developmental data. Data was de-identified and handled confidentially. No additional intervention was done specifically for the present analysis. The study was conducted in accordance with the ethical principles applicable to research involving human participants.
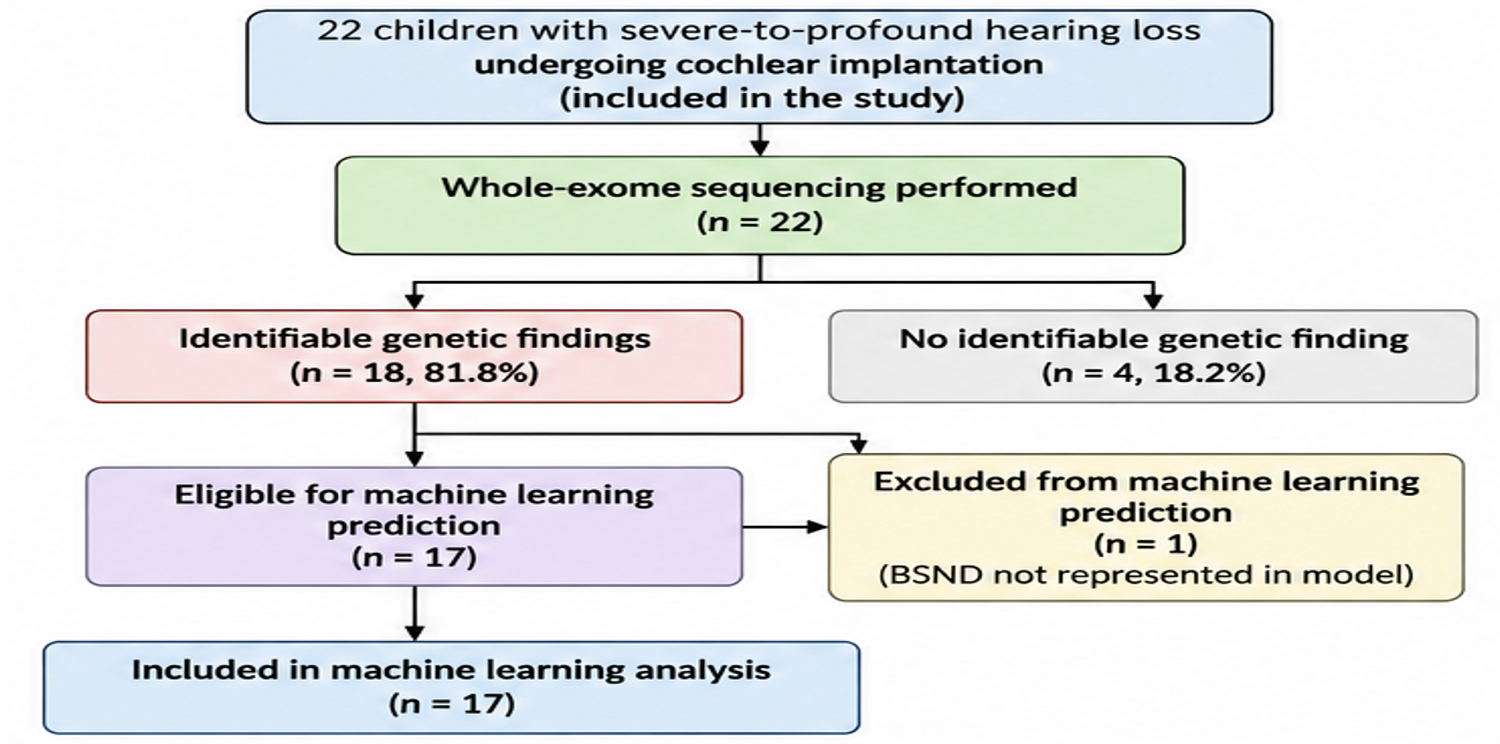
All children with severe to profound hearing loss who underwent cochlear implant surgery at the centre were included. Those patients for whomgenetic evaluation (whole-exome sequencing) report, relevant preoperative clinical data, including age at cochlear implantation and duration of deafness, postoperative clinical outcome data were available were included in the study. Patients without adequate clinical or postoperative outcome data and genetic testing report were excluded. The flow diagram of patient selection and eligibility for machine learning analysis is depicted in Fig 1.
Clinical and demographic data were collected for all 22 patients included in the study. Clinical variables like age, sex, age at cochlear implantation, and laterality of implantation (unilateral or bilateral) were recorded in a proforma designed for the study. Clinical outcome measures recorded following cochlear implantation included Categories of Auditory Performance (CAP) scores, receptive language age (RLA), expressive language age (ELA), and actual speech outcome.10 Developmental assessment data were also collected using the COM-DEALL (Communication-Developmental Eclectic Approach to Language Learning)assessment, including the gross motor, fine motor, activities of daily living, cognitive, social, and emotional domains.
All 22 patients were genetically evaluated by whole-exome sequencing (WES) in the same laboratory. Genomic DNA was extracted from peripheral blood samples. Whole-exome libraries were prepared using target sequence enrichment and sequenced on an Illumina platform Genetic variants were identified using the DRAGEN software and interpreted using the StrandOmics platform. WES test was done for 2428 genes and 37 mitochondrial genes.
Genetic variants associated with hearing loss were subsequently identified and classified. The genetic report provided information on the gene, specific variant, zygosity and variant classification. For example, if a pathogenic variant (classification provided in accordance with American College of Medical Genetics and Genomics/ACMG) was detected in a gene related to hearing loss, it was reported as positive with the corresponding zygosity and clinical significance being specified in the report.
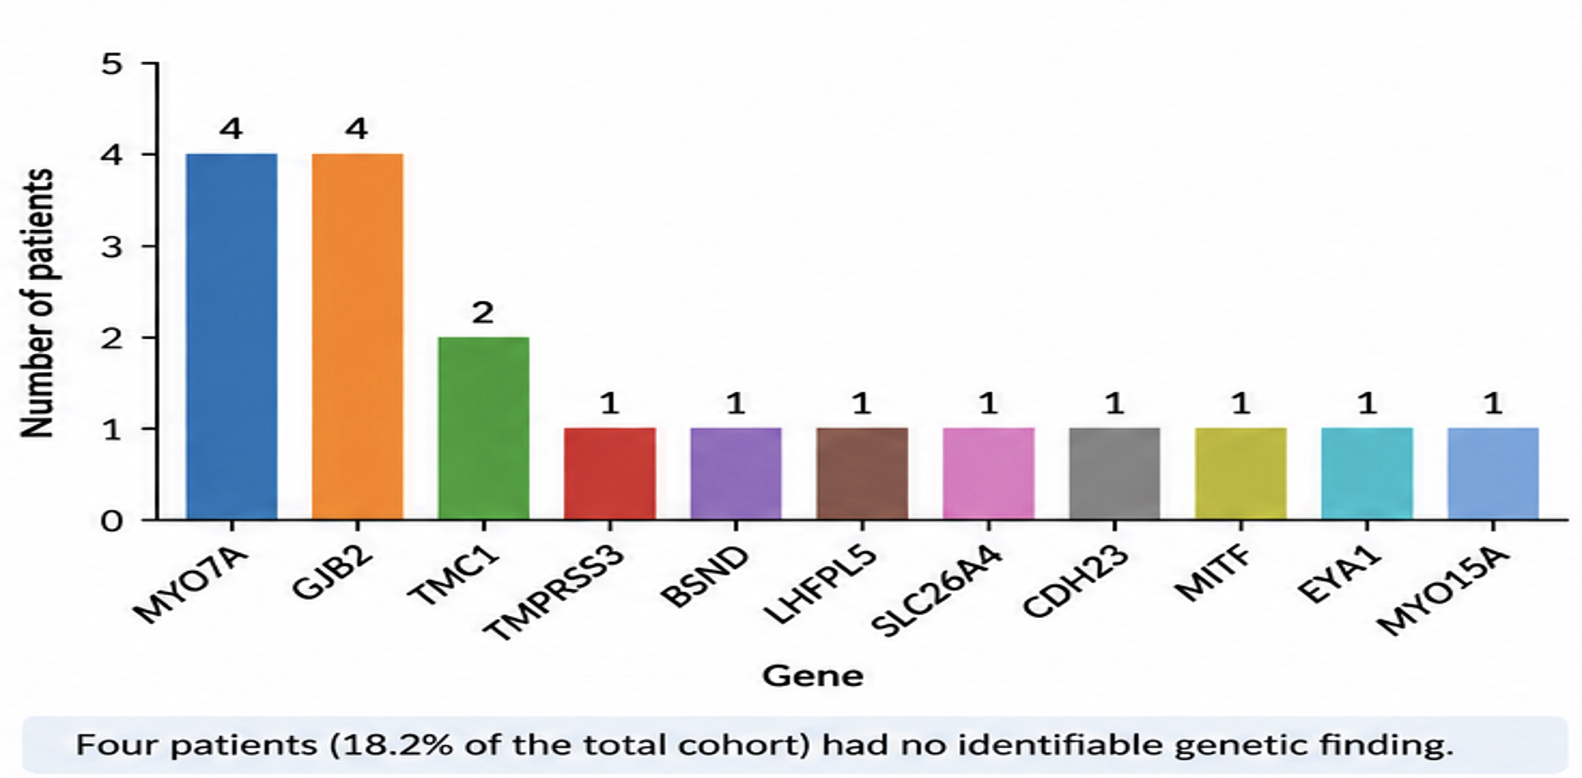
An identifiable genetic finding was present in 18 patients out of the 22 patients in the study group. Four patients had no likely disease-causing variant identified on WES. The identified genetic findings in the study group included variants inMYO7A, GJB2, TMC1, TMPRSS3, BSND, LHFPL5, SLC26A4, CDH23, MITF, EYA1, andMYO15A.
The genetic findings were then evaluated for the applicability of the machine learning model described previously.9 As BSND gene was not represented/listed in the model, this patient could not be entered in the model. Thus,17 patients were eligible for model-based prediction and clinical validation.
Clinical speech and auditory performance measures were used to assess postoperative speech and auditory outcomes after cochlear implantation. The Categories of Auditory Performance (CAP) score, receptive language age (RLA) and expressive language age (ELA) were recorded for each patient. Postoperative clinical assessment was done to determine the actual speech outcome. It served as reference outcome for comparison with the prediction generated by the machine learning model.
The actual postoperative speech outcome was classified as good, average, or poor according to the overall clinical assessment and the COM-DEALL assessment. A “good outcome” was considered when the child’s hearing, speech and language performance were age appropriate. “Average” was assigned when performance was near the expected age-appropriate level with some degree of developmental difference. A “poor” outcome was labelled when the above parameters were delayed and below the expected level for age.
Developmental and communication skills were measured by the COM-DEALL Developmental Profile which is a structured measure of developmental and communication domains. The domains of gross motor, fine motor, activities of daily living, social, cognitive and emotional development were assessed. Language development measures used were receptive language age (RLA) and expressive language age (ELA).
COM-DEALL domain scores and language-age measures were evaluated against machine learning model predicted speech outcomes.
The previously published machine learning model was applied to the 17 patients with an identified genetic finding. The model takes the identified gene and age at cochlear implantation as input variables and outputs a Speech Predictor Score, predicted speech-outcome label and CI Outcome Predictor Result (%). The model was applied on the clinical cohort and the predicted outcomes were compared with the observed postoperative speech outcomes and developmental assessment measures.
Seventeen patients were eligible for model-based prediction. The model-generated predicted speech outcome was compared with the observed postoperative speech outcome recorded during clinical follow-up. The model-generated (i) success probability (%) (ii) Speech Predictor Score (value in decimal) and (iii) predicted outcome label (0/1). The actual speech outcomes were calculated as -good, average and poor.
Predicted speech outcomes were compared with actual speech outcomes. The predicted outcomes were further compared with postoperative clinical and developmental measures, including CAP, receptive language age (RLA), expressive language age (ELA), and relevant COM-DEALL developmental domains.
Continuous variables were summarized using mean and standard deviation (SD) or median and interquartile range (IQR). Categorical variables were presented as frequencies and percentages. Descriptive statistics were used to summarize the demographic, clinical, genetic, cochlear implantation and developmental characteristics.
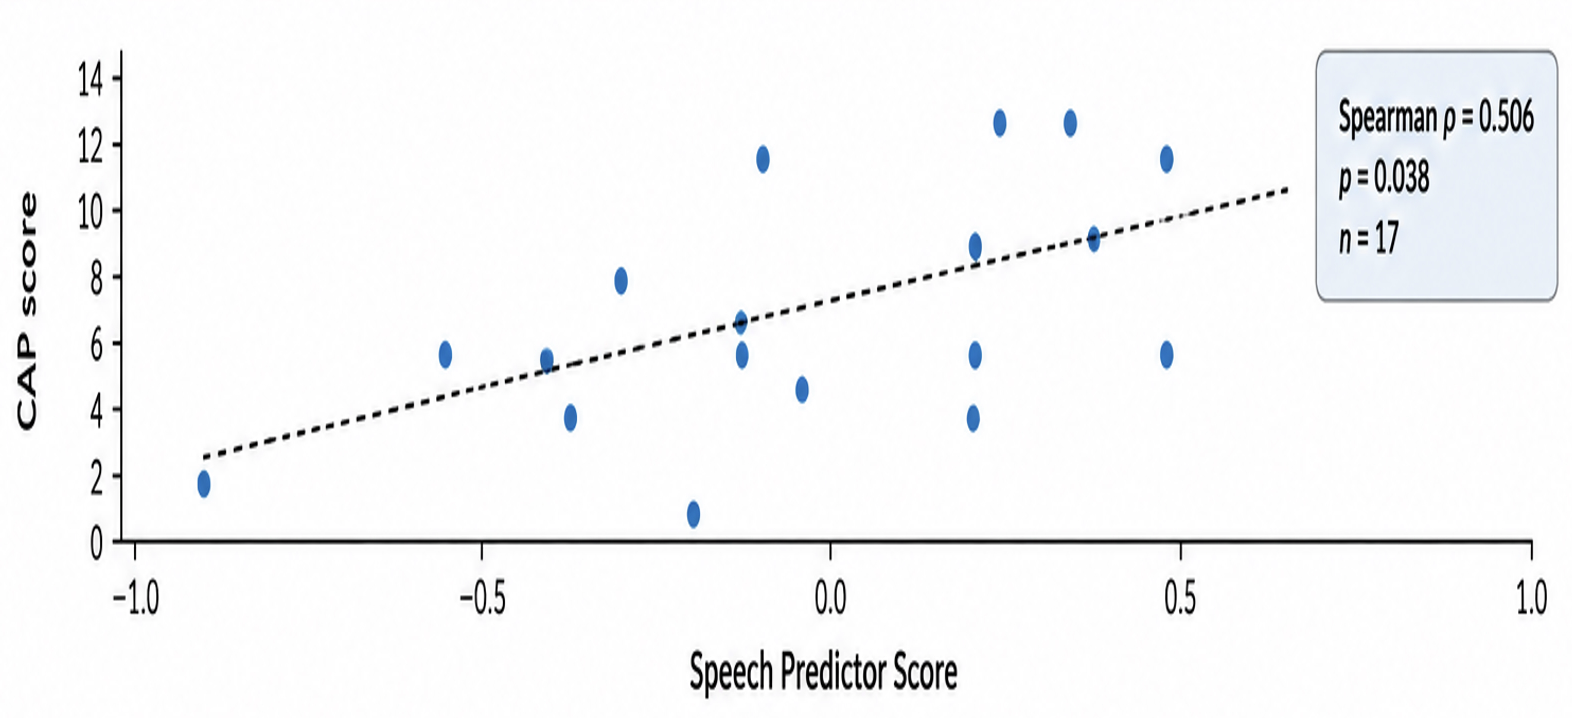
The associations between the machine learning–generated Speech Predictor Score, CI Outcome Predictor Result (%) and postoperative clinical and developmental outcomes including CAP score were assessed using Spearman’s rank correlation coefficient.
Differences in machine learning outputs across the three categories of actual postoperative speech outcome (good, average and poor) were explored using the Kruskal–Wallis test. Associations between clinical factors, including age at implantation, duration of deafness, hearing-aid use, family history and comorbidities, and actual postoperative speech outcome were assessed using appropriate non-parametric tests. A p-value <0.05 was considered statistically significant.
Figure 1
Results
3.1 Patient Characteristics
Table 1. Demographic and Clinical Characteristics of the Study Group
|
Characteristic |
Result |
|
Total patients
|
22 |
|
Sex, n (%)
|
|
-Male |
15 (68.2%) |
-Female |
7 (31.8%) |
|
Age at implantation, months
|
31.5 (26.75–38.25) |
-Range |
13–57 |
|
Unilateral implantation
|
18 (81.8%) |
|
Bilateral implantation
|
4 (18.2%) |
|
Hearing-aid use before implantation
|
|
-Yes |
11 (50.0%) |
-No |
11 (50.0%) |
|
Positive family history
|
6 (27.3%) |
|
Comorbidity present
|
7 (31.8%) |
|
Normal imaging
|
20 (90.9%) |
-Short cochlea |
1 (4.5%) |
-Hypoplastic nerve |
1 (4.5%) |
Mean age at implantation was 33.2 months (range: 13–57 months). Seven patients had comorbidities with Attention Deficit Hyperactivity Disorder (ADHD) in four patients, global developmental delay (GDD) in two patients and mild autism in one patient. Demographic and clinical characteristics of the study group are described in Table 1.
3.2 Genetic Findings
Eighteen patients (81.8%) had an identifiable genetic finding with MYO7A and GJB2 being the most frequently represented genes found in four patients each (Fig 2). Other genes identified are mentioned in Table 2. The identified variants involved multiple exons, with some patients showing variants involving more than one exon. Homozygous variants were seen in 10 patients (55.6% of those with identifiable genetic finding; 45.5% of the total study group whereas 8 patients (44.4% of those with an identifiable finding; 36.4% of the total cohort) had heterozygous variants, including one patient with compound heterozygous variants (Table 2b). No identifiable genetic finding was detected in four patients (18.2%).
Among the 22 patients, pathogenic variants were identified in 9 patients and likely pathogenic variants in 6 patients. Variants of uncertain significance (VUS) were reported in 4 patients, while variants of uncertain significance with probable damaging effect (VUSD) were reported in 2 patients. Several patients had more than one variant with different classifications.
Table 2a: Genetic findings in the study group
|
Genetic finding
|
n (%)
|
Specific variant (HGVS nomenclature)
|
Exon
|
No identifiable genetic finding |
4 (18.2%) |
- |
|
Identifiable genetic finding |
18 (81.8%) |
- |
|
-MYO7A |
4 (18.2%) |
c.5944G>A; p.Gly1982Arg (3) |
Exon 43 (3); Exon 6 (1) |
-GJB2 |
4 (18.2%) |
c.1A>G; p.Met1? (1) |
Exon 2 (3); Exon 1 (1) |
-TMC1 |
2 (9.1%) |
c.2004T>G; p.Ser668Arg (1) c.100C>T; p.Arg34Ter (1) |
Exon 21 (1); Exons 7 and 15 (1) |
-TMPRSS3 |
1 (4.5%) |
c.1216T>C; p.Cys406Arg |
Exon 12 |
-BSND |
1 (4.5%) |
c.452delC; p.Pro151LeufsTer27; c.440_442delGAG; p.Gly147del; c.23G>A; p.Arg8Gln | Exons 3 and 1 |
-LHFPL5 |
1 (4.5%) |
c.220_221dupTC; p.Ser75ProfsTer11 | Exon 1 |
-SLC26A4 |
1 (4.5%) |
c.716T>A; p.Val239Asp | Exons 6 and 2 |
-CDH23 |
1 (4.5%) |
c.6050-9G>A |
Intron 46 and Exon 16 |
-MITF |
1 (4.5%) |
c.1002_1008del; p.Gly335Terfs |
Exon 8 |
-EYA1 |
1 (4.5%) |
c.646C>T; p.Pro216Ser |
Exon 9 |
-MYO15A |
1 (4.5%) |
c.3661G>T; p.Glu1221Ter | Exon 3 |
|
Zygosity
|
n (%)
|
Homozygous |
10 (55.6%) |
Heterozygous |
8 (44.4%) |
3.3 Postoperative Auditory, Speech and Developmental Outcomes.
The post-operative auditory, speech and developmental outcomes are summarized in Table 3. The mean CAP score was 6 with a range of 2-12. Thirteen patients (59.1%) showed a good postoperative speech outcome, while 6 (27.3%) had an average outcome and 3 (13.6%) had a poor outcome.
|
Outcome measure
|
Result
|
|
Mean CAP score
|
6.1 (4–7.75) |
-Range of CAP |
2–12 |
|
Actual speech outcome, n (%)
|
|
-Good |
13 (59.1%) |
-Average |
6 (27.3%) |
-Poor |
3 (13.6%) |
Developmental Checklist (n = 17)
|
COM-DEALL domain
|
n |
Median developmental age (months)*
|
Range (months)*
|
|
Gross motor
|
17 |
33
|
15–69
|
|
Fine motor
|
17 |
33
|
15–69
|
|
Activities of daily living
|
17 |
33
|
21–69
|
|
Receptive language age (RLA)
|
17 |
21
|
9–69
|
|
Expressive language age (ELA)
|
17 |
21
|
9–69
|
|
Cognitive skills
|
17 |
33
|
21–69
|
|
Social skills
|
17 |
27
|
15–69
|
|
Emotional skills
|
17 |
33
|
15–69
|
*Values represent developmental age in months. Developmental age bands
were converted to their midpoint for
calculation of median and range.
There was considerable inter-individual variability across the COM-DEAL domains in the developmental performance. The median developmental age was 33 months for gross motor, fine motor, cognitive and emotional domains, and 33 months for activities of daily living, with median receptive and expressive language ages of 21 months. Social skills showed a median developmental age of 27 months. Developmental age ranges varied from 15–69 months across most domains, while receptive and expressive language ages ranged from 9–69 months.
3.4 Application of the Machine Learning Model
Of the 22 patients who underwent genetic evaluation, 18 had an identifiable genetic finding. One patient with a BSND variant could not be evaluated using the existing model because BSND was not represented in the model. Therefore, 17 patients were eligible for model-based prediction.
Table 4: Patient Eligibility for Machine Learning Model Prediction
|
Parameter
|
n (%)
|
Total patients |
22 |
Patients with identifiable genetic finding |
18 (81.8%) |
Patients eligible for model prediction |
17 (77.3% of total) |
|
Patients without model prediction -No identifiable genetic finding - Gene not represented in model (BSND) |
5 (22.7%) 4 1 |
The model uses gene and age at implantation as inputs and generates a Speech Predictor Score, binary predicted label
and a CI Outcome Predictor Result (in % age).
The results are depicted in Table 5.
|
ML output
|
n (%)
|
|
CI Outcome Predictor Result
|
|
-100% |
11 (64.7%) |
-25% |
1 (5.9%) |
-0% |
5 (29.4%) |
|
Speech Predictor Score
|
|
-Median |
0.00 |
-Mean ± SD |
0.024 ± 0.608 |
-Range |
−0.810 to 0.700 |
|
Predicted label
|
|
-Label 1 |
11 (64.7%) |
-Label 0 |
6 (35.3%) |
The machine learning model prediction results for 17 patients are summarized in Table 5. The CI Outcome Predictor Result was 100% in 11 patients (64.7%), 25% in one patient (5.9%), and 0% in five patients (29.4%). The Speech Predictor Score had a median of 0.00, with a mean ± SD of 0.024 ± 0.608 and a range of −0.810 to 0.700. Eleven patients (64.7%) were classified as predicted label 1 and 6 patients (35.3%) as predicted label 0.
|
Actual speech outcome
|
Predicted label 0
|
Predicted label 1
|
Total
|
Good |
2 |
9 |
11 |
Average |
1 |
2 |
3 |
Poor |
3 |
0 |
3 |
|
Total
|
6
|
11
|
17
|
The association between the model generated predicted labels and the clinically assessed postoperative speech outcome was studied in 17 patients. Among the 11 patients classified as “good” actual speech outcome, 9 had predicted label 1 and 2 had predicted label 0 in the model. Of the 3 patients with “average” outcome, 2 had label 1 and 1 had label 0. The three patients with a “poor” speech outcome were all predicted to be label 0. Overall, among the eleven patients with good outcome, 9 (81.8%) had predicted label 1 while no patient with actual poor outcome was assigned label 1.
Thus, the model showed a greater tendency to assign label 1 among patients with good postoperative speech outcomes, whereas all patients with poor outcomes were assigned label 0.
|
Actual speech outcome
|
n
|
Mean ± SD (%)
|
Median (%)
|
Range (%)
|
Good |
11 |
81.8 ± 40.5 |
100 |
0–100 |
Average |
3 |
66.7 ± 57.7 |
100 |
0–100 |
Poor |
3 |
8.3 ± 14.4 |
0 |
0–25 |
|
Overall
|
17
|
66.2 ± 47.6
|
100
|
0–100
|
Table 7 shows the CI outcome predictor result according to actual speech outcome. It was seen that patients with good/better actual speech outcome had higher predicted CI outcome percentages although the result did not reach statistical significance (Kruskal-Wallis comparison- H=5.303, p=0.071). It is important to note that all three patients with poor postoperative speech outcomes had predictor results between 0% and 25%, whereas patients with good or average outcomes predominantly had higher predictor percentages.
|
Actual speech outcome
|
n
|
Mean ± SD
|
Median
|
Range
|
Good |
11 |
0.228 ± 0.536 |
0.450 |
−0.723 to 0.700 |
Average |
3 |
−0.008 ± 0.712 |
0.000 |
−0.723 to 0.700 |
Poor |
3 |
−0.691 ± 0.138 |
−0.723 |
−0.810 to −0.539 |
|
Overall
|
17
|
0.024 ± 0.608
|
0.000
|
−0.810 to 0.700
|
Speech predictor score was higher in patients with good and average speech outcomes than in patients with poor outcomes, although the difference between groups did not reach statistical significance (Kruskal–Wallis test- H = 4.667, p = 0.097). For each of the 17 patients, the value of speech predictor score & CI Outcome predictor (%) was compared with CAP score.
|
ML variable
|
CAP: Spearman ρ
|
p-value
|
Speech Predictor Score |
0.506 |
0.038
|
CI Outcome Predictor Result (%) |
0.267 |
0.300 |
The Speech Predictor Score showed a moderate positive correlation with post operative CAP score (Spearman's ρ = 0.506, p = 0.038) which was statistically significant (Fig 3). This suggests that higher speech predictor scores by the model were associated with better auditory performance as assessed by CAP score. In contrast, CI Outcome Predictor Result (%) showed a weak positive correlation with CAP score, which did not reach statistical significance (Spearman’s ρ = 0.267, p = 0.300).
|
Clinical factor
|
Finding
|
Age at implantation vs predictor score |
ρ = 0.177, p = 0.496 |
Duration of deafness vs predictor score |
ρ = 0.377, p = 0.136 |
As shown in Table 10, age at implantation and duration of deafness were not significantly correlated with the ML Speech Predictor Score (Spearman's ρ = 0.177, p = 0.496 and ρ = 0.377, p = 0.136, respectively).
|
Clinical factor
|
Good (n=13)
|
Average (n=6)
|
Poor (n=3)
|
p value
|
Age at implantation, months, median (IQR) |
32 (30–36) |
31.5 (27.3–41) |
26 (23–32.5) |
0.673 |
Duration of deafness, months, median (IQR) |
30 (28–35) |
30.5 (26.8–37.3) |
27 (23.5–33.5) |
0.818 |
CAP score, median (IQR) |
6 (4–9) |
4.5 (4–5) |
6 (4.5–7.5) |
0.229 |
Hearing-aid use, n (%) |
6 (46.2) |
4 (66.7) |
1 (33.3) |
0.708 |
Family history, n (%) |
3 (23.1) |
1 (16.7) |
2 (66.7) |
0.331 |
|
Comorbidity, n (%)
|
2 (15.4)
|
2 (33.3)
|
3 (100)
|
0.020
|
Age at implantation, duration of deafness, hearing-aid use and family history were not significantly associated with postoperative speech outcome (Table 11). However, comorbidities were significantly more frequent among children with poorer speech outcomes ( p = 0.020).
Discussion
The present study aimed to evaluate the performance of a previously developed machine learning model to predict speech outcome on a new independent group of cochlear implant recipients. In this cohort, 18 patients (81.8%) out of 22 patients had an identifiable genetic finding and 17 were eligible for model-based AI prediction. Variants in MYO7A and GJB2 were the most frequently identified genetic finding.
A significant finding was the moderate positive correlation seen between the Speech Predictor Score generated by the model and the CAP score assessed by the audiologist generated by the model had better auditory performance. However, the CI Outcome Predictor showed a weak, non-significant correlation with CAP. This suggests that the model has the potential to predict the postoperative auditory function of the patient.
On comparison of actual and predicted speech outcome (using predicted label 1 and 0), it was seen that eleven children with “good” actual outcome had a predicted label 1 on the model and all three children with a “poor” outcome were assigned predicted label 1. Similarly, the CI Outcome Predictor Result (%) and Speech Predictor Score were higher in children with “good” actual outcome and lower in those with “poor” outcomes. The difference was not statistically significant (p = 0.071 and p = 0.097, respectively) which could be because of small sample size.
The study also shows the heterogeneity of genetic etiologies in children undergoing cochlear implantation. Majority (81.8%) of children in the study had an identifiable genetic finding. This is consistent with previous studies that have shown genetic heterogeneity in among children undergoing cochlear implantation.11, 12 Previous studies have shown good hearing results after cochlear implants in children with GJB2 and SLC26A4-related hearing loss, but the effect of the genotype may be influenced by the age at which the implant was done and other clinical factors.13 Interestingly, one child had a BSND variant and could not be evaluated in the ML model as the gene was not represented. This forms a major limitation of AI models based on genetic findings. There is a need for continued expansion of the genetic input as we have more genotypic data available.
Various clinical factors (age at implantation, duration of deafness, comorbidities) were correlated with the Speech Predicter Score. It was seen that age at implantation and duration of deafness were not significantly associated with the Speech Predictor Score, whereas associated comorbidities were more frequent in children with “poor” actual speech outcomes (p = 0.020). Comorbid condition like ADHD, global developmental delay and autism, as seen in this study group, can affect overall neurodevelopment, attention, cognition, social communication and participation in rehabilitation. Poor outcomes in children with additional disabilities has been described in previous studies.14 However, as the sample size was small, this finding can be considered exploratory and should be confirmed in larger studies. The results suggest that neurodevelopmental status of the child should be taken into consideration in addition to age and genetic factors to predict outcome following cochlear implantation.
The small sample size and single centre design limit the generalisability of our results. Moreover, the model needs refinement and expansion of genetic dataset as one gene was not represented in the model. Larger multicentric studies are required for further validation of the model. Such models should be regarded as supportive tools in clinical decision making rather than a substitute for clinical assessment.
Figure 2
Figure 3
Conclusion
To conclude, the study provides potential of a machine learning model based on genetic etiology and age to predict speech and auditory outcomes following cochlear implant surgery in children with hearing loss. As there was significant correlation between the Speech Predictor Score generated by the model and the post operative CAP score, it suggests that the model can be used as an adjunctive tool to clinical assessment and guide decision making and counselling for patients before surgery. However, there is need for expansion of the genetic dataset and validation in larger studies.
Acknowledgements
The author would like to acknowledge Dr. Divya Agarwal, Senior Consultant, Apollo Genomics Institutes, Indraprastha Apollo Hospitals, Delhi for her critical review of the manuscript and valuable suggestions. She is thankful to Ms. Silky Kumari, Clinical Audiologist and Ms. Samriddhi Nijhawan, Senior Clinical CI Audiologist and Auditory Verbal Therapist, Sankalp ENT & Cochlear Implant Center, Dwarka New Delhi, for their valuable assistance in providing patient data for clinical validation of the model.
References/Inspiration
- Korver AM, Smith RJ, Van Camp G, Schleiss MR, Bitner-Glindzicz MA, Lustig LR, Usami SI, Boudewyns AN. Congenital hearing loss. Nat Rev Dis Primers. 2017 Jan 12;3:16094. doi:10.1038/nrdp.2016.94. PMID: 28079113; PMCID: PMC5675031.
- Yoshimura H, Okubo T, Shinagawa J, Nishio SY, Takumi Y, Usami SI. Epidemiology, aetiology and diagnosis of congenital hearing loss via hearing screening of 153 913 newborns. Int J Epidemiol. 2024 Apr 11;53(3):dyae052. doi:10.1093/ije/dyae052. PMID: 38609324; PMCID: PMC11014784.
- Wu SS, Sbeih F, Anne S, Cohen MS, Schwartz S, Liu YC, Appachi S. Auditory Outcomes in Children Who Undergo Cochlear Implantation Before 12 Months of Age: A Systematic Review. Otolaryngol Head Neck Surg. 2023 Aug;169(2):210-220. doi:10.1002/ohn.284. Epub 2023 Feb 7. PMID: 36939587
- Birman CS, Elliott EJ, Gibson WP. Pediatric cochlear implants: additional disabilities prevalence, risk factors, and effect on language outcomes. Otol Neurotol. 2012 Oct;33(8):1347-52. doi:10.1097/MAO.0b013e31826939cc. PMID: 22975903.
- Fehrmann MLA, Haer-Wigman L, Kremer H, Yntema HG, Thijssen MEG, Mylanus EAM, Huinck WJ, Lanting CP, Pennings RJE. Cochlear Implantation Outcomes in Genotyped Subjects with Sensorineural Hearing Loss. J Assoc Res Otolaryngol. 2025 Jun;26(3):331-348. doi:10.1007/s10162-025-00987-0. Epub 2025 Apr 23. PMID: 40268851; PMCID: PMC12133674.
- Carlson RJ, Walsh T, Mandell JB, Aburayyan A, Lee MK, Gulsuner S, Horn DL, Ou HC, Sie KCY, Mancl L, Rubinstein J, King MC. Association of Genetic Diagnoses for Childhood-Onset Hearing Loss With Cochlear Implant Outcomes. JAMA Otolaryngol Head Neck Surg. 2023 Mar 1;149(3):212-222. doi:10.1001/jamaoto.2022.4463. PMID: 36633841; PMCID: PMC9857764.
- Mo JT, Chong DS, Sun C, Mohapatra N, Jiam NT. Machine-Learning Predictions of Cochlear Implant Functional Outcomes: A Systematic Review. Ear Hear. 2025 Jul-Aug 01;46(4):952-962. doi:10.1097/AUD.0000000000001638. Epub 2025 Jan 29. PMID: 39876044.
- Nair APS, Mishra SK, Alba Diaz PA. A systematic review of machine learning approaches in cochlear implant outcomes. NPJ Digit Med. 2025 Jul 5;8(1):411. doi:10.1038/s41746-025-01733-9. PMID: 40617985; PMCID: PMC12228805.
- Mrig N, Singh N. A machine learning framework for predicting speech outcomes in cochlear implant recipients using genetic markers. Young Scientist Journal. 2026 May 15.
- Archbold S, Lutman ME, Marshall DH. Categories of Auditory Performance. Ann Otol Rhinol Laryngol Suppl. 1995 Sep;166:312-4. PMID: 7668685.
- Seligman KL, Shearer AE, Frees K, Nishimura C, Kolbe D, Dunn C, Hansen MR, Gantz BJ, Smith RJH. Genetic Causes of Hearing Loss in a Large Cohort of Cochlear Implant Recipients. Otolaryngol Head Neck Surg. 2022 Apr;166(4):734-737. doi:10.1177/01945998211021308. Epub 2021 Jun 22. PMID: 34154485; PMCID: PMC9128025
- Nishio SY, Usami SI. Outcomes of cochlear implantation for the patients with specific genetic etiologies: a systematic literature review. Acta Otolaryngol. 2017 Jul;137(7):730-742. doi:10.1080/00016489.2016.1276303. Epub 2017 Feb 24. PMID: 28498079.
- Wu CM, Ko HC, Tsou YT, Lin YH, Lin JL, Chen CK, Chen PL, Wu CC. Long-Term Cochlear Implant Outcomes in Children with GJB2 and SLC26A4 Mutations. PLoS One. 2015 Sep 23;10(9):e0138575. doi:10.1371/journal.pone.0138575. PMID: 26397989; PMCID: PMC4580418.
- Birman CS, Elliott EJ, Gibson WP. Pediatric cochlear implants: additional disabilities prevalence, risk factors, and effect on language outcomes. Otol Neurotol. 2012 Oct;33(8):1347-52. doi:10.1097/MAO.0b013e31826939cc. PMID: 22975903.

No comments yet.